How do I read my TikTok retention curve?
Your TikTok retention graph shows how the share of viewers still watching changes through the video. Read a percentage at a specific second, find the first meaningful decline, then watch that moment. Average watch time and completion answer different questions. Use the graph to choose where to investigate, not to declare why people left.
If you want the product-led workflow, see what a trustworthy TikTok video analysis tool can establish from the video and what requires private analytics. If you already know the timestamp, use the deeper guide to diagnose why viewers drop off on TikTok.
What the TikTok retention curve measures
The audience-retention graph shows the share of viewers who remain at each moment of a video. Time runs from left to right. The percentage of viewers still watching runs from top to bottom. A steep section means viewers left quickly during that interval; a flatter section means the remaining audience stayed at a more stable rate.
TikTok lets creators open analytics for individual posts through TikTok Studio or the More insights option on a post. The exact labels and available metrics can vary by app version, region, account, and post. Use the graph and metrics TikTok shows for that post rather than assuming every account exposes the same screen.
The curve is behavioral evidence. It can confirm the moment attention changed, but it cannot prove the cause by itself. The cause is a hypothesis you form by matching the timestamp to the video.
Retention rate, average watch time, and completion are different
- Retention at a timestamp
- Read the graph at a named second. The percentage under the cursor describes that moment in the curve. It is not an average for the whole video.
- Average watch time
- This is a duration, not a count of finishers. In the real example below, 9.44 seconds of average watch time divided by the video's reported 26-second length gives about 36.3% of its length on average. It does not mean 36.3% of viewers finished or remained at a particular second.
- Watched full video
- Read the completion metric reported for the post. Do not calculate it from average watch time. Keep the platform's metric name, reporting period, and denominator beside the number you record.
Check whether a metric includes replay time and whether its denominator is views, people, or impressions before comparing exports. TikTok's Ads Manager documentation, for example, defines average play time per user separately from average play time per video view and includes replay time in both. Those are paid-ad definitions, not a reason to relabel an organic TikTok Studio metric.
A real TikTok retention graph: Kristijonas's Rio video
Kristijonas Klimaitis shared a Portuguese-language travel video about Morro Dois Irmãos in Rio de Janeiro in One Peak's student-wins bank. His November 14, 2025 submission included the video link, the analytics screenshot and permission to feature the win on our website.
The screenshot was updated on November 13, 2025. It shows 897K views, 9.44 seconds average watch time and 7% watched the full video. Those are this post's recorded metrics, not current totals, a retention benchmark or evidence that Format Finder caused the result.
Real creator analytics, shared with permission
Swipe the graph sideways to inspect the full 26-second timeline.
View the original analytics screenshot
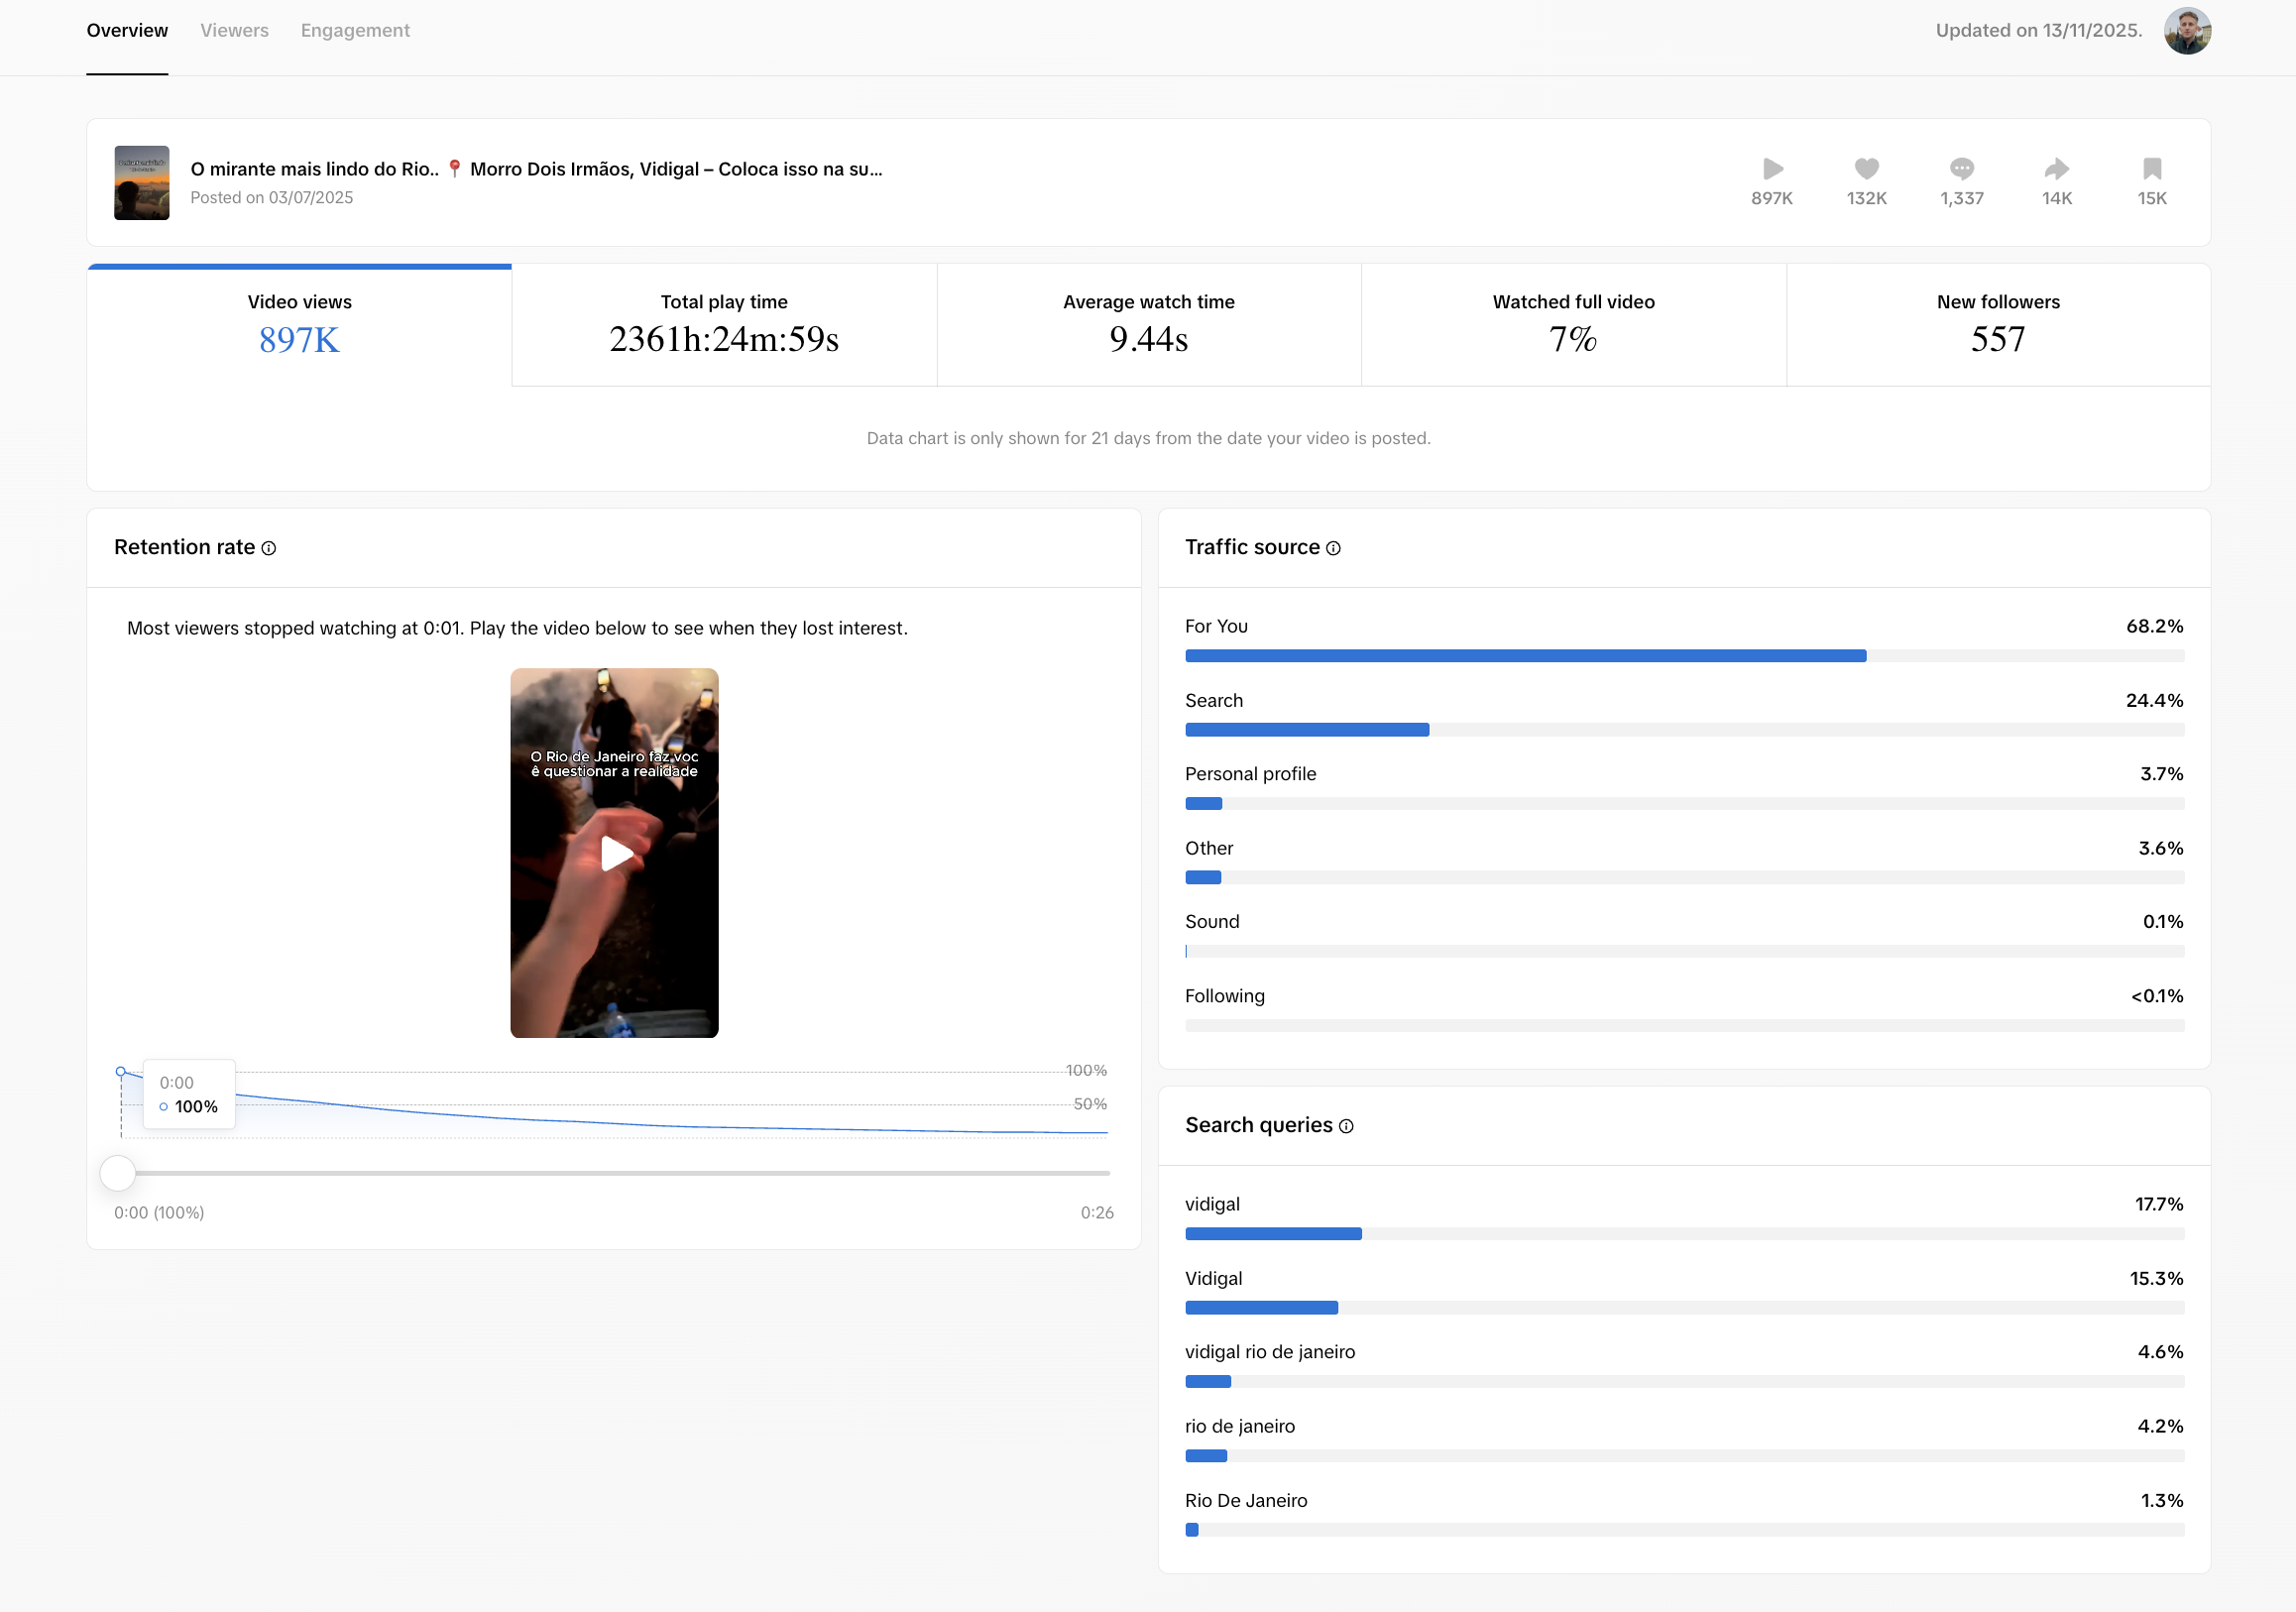
Here is the distinction the real data makes clear: 9.44 ÷ 26 × 100 ≈ 36.3% is an average watched-length ratio using the reported video length. TikTok separately reports 7% completion. Neither number tells you the exact percentage still watching at one second. Keep all three measures separate.
Pair the graph with Kristijonas's original Rio video. Start by inspecting the first second: the visible promise, first frame and what arrives next. The screenshot tells you when viewers left; it does not prove which creative choice caused that behavior. A video can reach a large audience and still have an early drop.
To measure a drop on your own interactive graph, subtract the later percentage from the earlier one. That gives percentage points. Divide the difference by the earlier percentage and multiply by 100 for the relative decline among viewers still present then. Do not invent tooltip readings from the shape of this screenshot.
Step 1: open the post analytics and save the context
Open the video from your profile, choose More insights, or find the post in TikTok Studio. Locate the audience-retention graph. Before interpreting it, write down:
- The video length and date posted.
- The topic and format, such as tutorial, story, list, or reveal.
- The opening promise in the first spoken line and first frame.
- Average watch time, completion, or other watch metrics TikTok makes available for the post.
- The comparison set: your own posts with similar length, topic, and format.
Similar-post comparisons matter because a 12-second reveal and a 60-second tutorial should not be judged against one universal curve. Traffic source and audience familiarity can also change the shape.
Step 2: find the first meaningful drop
Look for the first point where the curve falls faster than the section immediately around it. Record the timestamp, then scrub the video to that second. Inspect the two seconds before and after it.
For an early drop, ask four concrete questions:
- Did the first frame make the topic clear before the viewer had to decode it?
- Did the opening line promise a specific payoff to a recognizable audience?
- Did the video begin with setup, greeting, branding, or dead air before delivering value?
- Did the visual and spoken hook make the same promise, or did they compete with each other?
Do not label every early decline a bad hook. An early decline alone does not establish a failure. The useful signal is whether this opening loses attention faster than your comparable posts and whether the timestamp exposes a fixable mismatch.
Step 3: map later cliffs to script and visual beats
Repeat the timestamp exercise for the steepest later declines. Write down the exact line, shot, on-screen text, and edit at each point. Then classify the moment before deciding what to change.
| Curve pattern | What to inspect | A clean next test |
|---|---|---|
| Sharp early cliff | First frame, opening line, clarity, and setup length | Start with the payoff or strongest proof instead of setup |
| Cliff after the hook | Whether the body immediately delivers the promised value | Move the first concrete example or result earlier |
| Steady mid-video decline | Repetition, explanation density, shot duration, and missing progress cues | Remove one repeated beat or add a clear visual progression |
| Late cliff before the payoff | Whether the promised result arrives too late | Reveal the result earlier, then explain how it happened |
| Flat or unusually strong section | The line, visual proof, tension, or pace that held attention | Reuse that beat structure in the next video |
Step 4: separate observation from explanation
Write each finding in two lines. The first line is what the data shows. The second is the most likely explanation you can test.
Observation
In the worked example, the steepest decline begins at 6 seconds, immediately after the product demonstration leaves the screen.
Testable explanation
The visual proof may be doing more work than the explanation that follows. In the next version, keep the proof visible while the first step is explained.
This distinction prevents the common mistake of treating a timestamp as a diagnosis. A drop beside a sentence could come from the sentence, the visual, the edit, a promise already fulfilled, or an audience mismatch. One controlled change gives you a better answer than a full rewrite.
Step 5: change one variable in the next comparable post
Choose the earliest high-impact moment you can improve. Keep the next video close enough in topic, length, audience, and format that the comparison remains useful. Change one main variable:
- Opening line.
- First visual frame.
- Time before the first proof or example.
- Order of the main script beats.
- Length of a shot or explanation.
- Position of the result or reveal.
Log the hypothesis before posting. When the next analytics window is mature enough to compare, check the same timestamp and surrounding section. If several variables change together, the result may improve, but you will not know which change mattered.
How Format Finder combines the video with real retention data
A published video and its private analytics contain different evidence. The video contains the hook, transcript, shots, edits, and pacing. The TikTok analytics screen contains real audience behavior. A video upload alone cannot reveal private retention metrics.
Open Analyze and add your video file or a supported Instagram, TikTok, or YouTube link. The initial analysis reviews craft. After publication, open Analytics and attach the matching post's analytics screenshot. Include readable axes, timestamps, and any summary metrics you want to use. Only evidence present in the screenshot can support the extracted metrics.
The Analytics view connects available retention metrics and drop-off timestamps with the video's transcript and frames. A missing hook or hold metric stays missing rather than becoming a measured result. This enrichment does not rewrite the original Action Plan tab. Compare the audience evidence with the craft review to choose your next test; do not treat a craft score as an observed retention rate.
After choosing the next test, use the One Click Editor to cut, caption, and refine the new footage. That keeps the workflow connected: idea, script, filmed video, edit, published result, and measured revision.
If you want the video review and analytics workflow in one place, see Format Finder plans and get started. You can use the manual graph-reading method above without a paid tool.
What not to conclude from one curve
- Do not use one universal three-second, midpoint, or completion target for every length, niche, format, and audience.
- Do not claim a single edit caused reach. Retention is one part of a larger distribution and audience response system.
- Do not compare a new tutorial with an old entertainment clip and call the difference a hook result.
- Do not change the hook, topic, length, pacing, and visual style at once if the goal is to learn from the test.
- Do not ignore the sections that held attention. The curve can show what to preserve as clearly as what to remove.
Sources
Creator-source check: September 16, 2026. The graph and metrics come from Kristijonas's consented student-wins submission and its original TikTok screenshot, updated November 13, 2025. The linked video's reported duration is 26 seconds. The screenshot pixels are unchanged; the graph above displays its retention region at a larger size. Product workflow was checked on September 10 against the application and its sample analysis surface, not a new paid analysis.
- TikTok Business Help Center: paid-ad video play metric definitions
- TikTok Support: creator tools and individual post analytics
- TikTok Business Help Center: key-frame peaks and valleys in Video Insights
Frequently asked questions
- Where do I find my TikTok retention graph?
- Open the individual post's analytics through More insights or TikTok Studio and look for its audience-retention graph. Available metrics differ across accounts, regions, posts, and app or web versions. If the graph is missing, use the watch metrics TikTok does show; neither a public post URL nor the video file can reveal a missing private graph.
- Is TikTok retention rate the same as average watch time?
- No. A point on the retention graph describes the share still watching at a particular second. Average watch time is a duration. Dividing average watch time by video length produces an average watched-length ratio, not the percentage of people who finished or the retention at a particular timestamp.
- How do I calculate the drop between two points on a retention graph?
- Subtract the later percentage from the earlier percentage to get a percentage-point change. For the relative decline among viewers still present at the earlier point, divide that difference by the earlier percentage, then multiply by 100. Read both percentages from the platform; do not infer exact points from a screenshot with no tooltip values.
- What is a good retention curve?
- There is no useful universal curve for every TikTok. Length, topic, audience, traffic source, and format all change the shape. Compare the video with your own posts of similar length and format, then look for the moments where it performs better or worse than that baseline.
- Does a drop-off prove why viewers left?
- No. The graph proves when the audience changed, not why. Use the timestamp to inspect the spoken line, visual, edit, and promise at that moment, then test one likely cause in a comparable next video.
- Does Format Finder do this for me?
- Format Finder analyzes the video's hook, structure, pacing, visuals, and transcript. Add the published video's platform analytics screenshot in Analytics to connect available retention data with the video. Only metrics visible in the supplied evidence can be extracted. The video file alone does not contain private retention metrics, and attaching analytics does not rewrite the original Action Plan tab.